
TikTok is now the #1 platform for influencer marketing, with 69% of brands using it for collabs—way ahead of Instagram (47%), YouTube (33%), and Facebook (28%). With over a billion users worldwide, TikTok lets brands connect with huge audiences in fun, creative ways. As more companies jump on the TikTok bandwagon and team up with creators, they need to figure out how to track their results. If you’re wondering how to measure your TikTok influencer campaigns, you’re in the right place! Keep reading for our guide on TikTok analytics and tracking influencer performance.
TikTok Tools & Metrics
Here are key metrics creators and brands can use to measure theirTikTok content:
- Engagement rate (likes, comments, shares divided by views)
- Video views
- Follower growth
- Watch time
- Video completion rate
- Hashtag performance
- Audience demographics (age, gender, location)
- Peak activity times of your followers
- Brand mention frequency (for influencer collaborations)
- Conversion rate (for campaigns with affiliate links)
- ROI
These metrics help you understand your audience, refine your content, and improve your overall TikTok performance.
If you have a business account on TikTok, you can access TikTok Analytics to track your performance data. This tool provides insights into your account’s engagement, audience demographics, and video performance. You can use this information to optimize your content strategy and increase your reach.
However, if you’re looking for more specific influencer data, an influencer marketing platform can give you even more insight. These specialized platforms, like Storyclash, can help you identify top-performing influencers on TikTok, track their engagement rates, and analyze their audience demographics.
With Storyclash, you can explore content and see important metrics for any creator or brand on TikTok, whether you are already working with them or not. as well as your own account.
How does TikTok work?
The social media platform TikTok (formerly musical.ly) allows only videos to be uploaded to one’s profile which makes it unique as other social networks accept different types of content formats.
TikTok has an algorithm-based feed that determines which content is shown, based on factors like your current location, watch time, repeat watching, commenting, liking, and sharing. Through Machine Learning Technology, TikTok can provide their users personalized video recommendations which makes it both very unique and addicting.
Comparison TikTok vs. Instagram vs. Facebook
Here is an overview of how TikTok compares to Instagram and Facebook in terms of users and content.
| TikTok | |||
| Users worldwide | 1.05 Bn. | 2.4 Bn. | 2,95 Bn. |
| User demographic | 41 % of TikTok users are between 16 and 24 years old | More than 50 % of Instagram users are 34 years or younger | Most users are between 25 and 34 years old |
| Supported content types |
videos, life-videos | pictures, videos, live-videos, reels, IG-TV, stories | pictures, videos, live-videos, stories, links, status updates |
| Display of content | personalized video recommendations | news feed of content of your liked accounts | news feed of content of your friends or liked sites |
| Focus | video sharing | photo sharing | information sharing |
(sources: https://de.statista.com/statistik/daten/studie/181086/umfrage/die-weltweit-groessten-social-networks-nach-anzahl-der-user/; https://www.statista.com/statistics/248769/age-distribution-of-worldwide-instagram-users/; https://www.statista.com/statistics/376128/facebook-global-user-age-distribution/; https://www.lifsperu.org/10-tiktok-statistics-that-you-should-know-in-2020-infographic/?doing_wp_cron=1600691789.4315519332885742187500)
How to use TikTok Analytics
If you have a TikTok business account, you can check some basic metrics for free with TikTok analytics.
On mobile:
- Go to your profile.
- Click on Settings then open the privacy tab in the top right-hand corner.
- Under Account, open the Creator Tools tab.
- From there, click on Analytics.
On desktop:
- Log in to TikTok.
- Hover over your profile photo in the top right.
- Click on View Analytics.
If you need to download your analytics data, you will need to use the desktop dashboard.
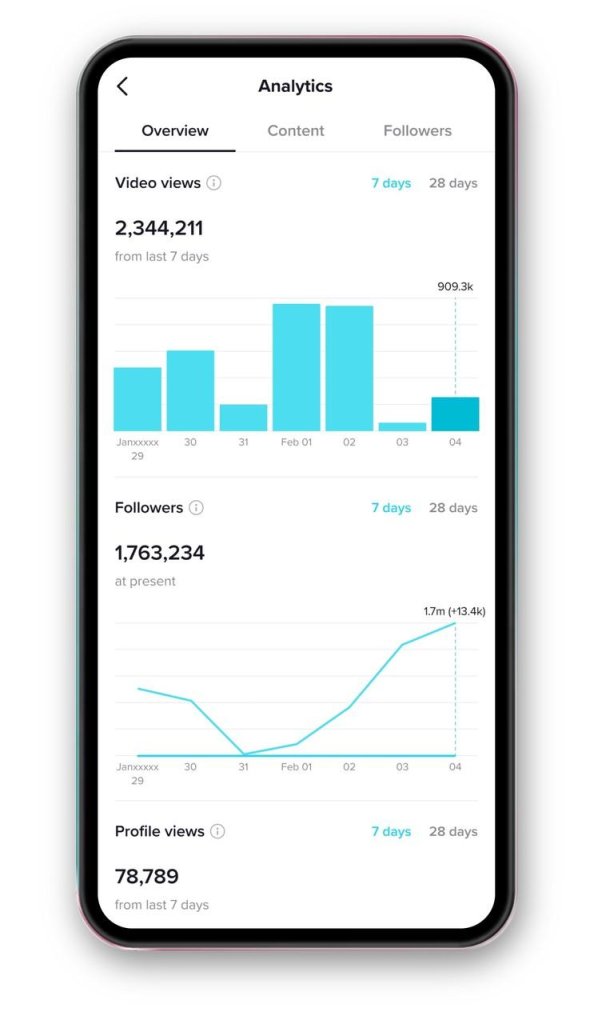
Tiktok offers three categories of analytics: Overview, Content, and Followers.
In the Overview tab, you can see data from the last week, month, or two months, or, you can select a custom date range up to 60 days. The content tab provides views, likes, comments and shares, which you can use to see which of your videos have been the most popular. The Follower tab gives you data about your followers, including location and gender.
However, this won’t allow you to see more in-depth metrics like estimated media value. And if you want to track TikTok accounts other than your own, such as competitor brands or creators you would like to work with, you will need a more comprehensive solution.
How to track brands on TikTok
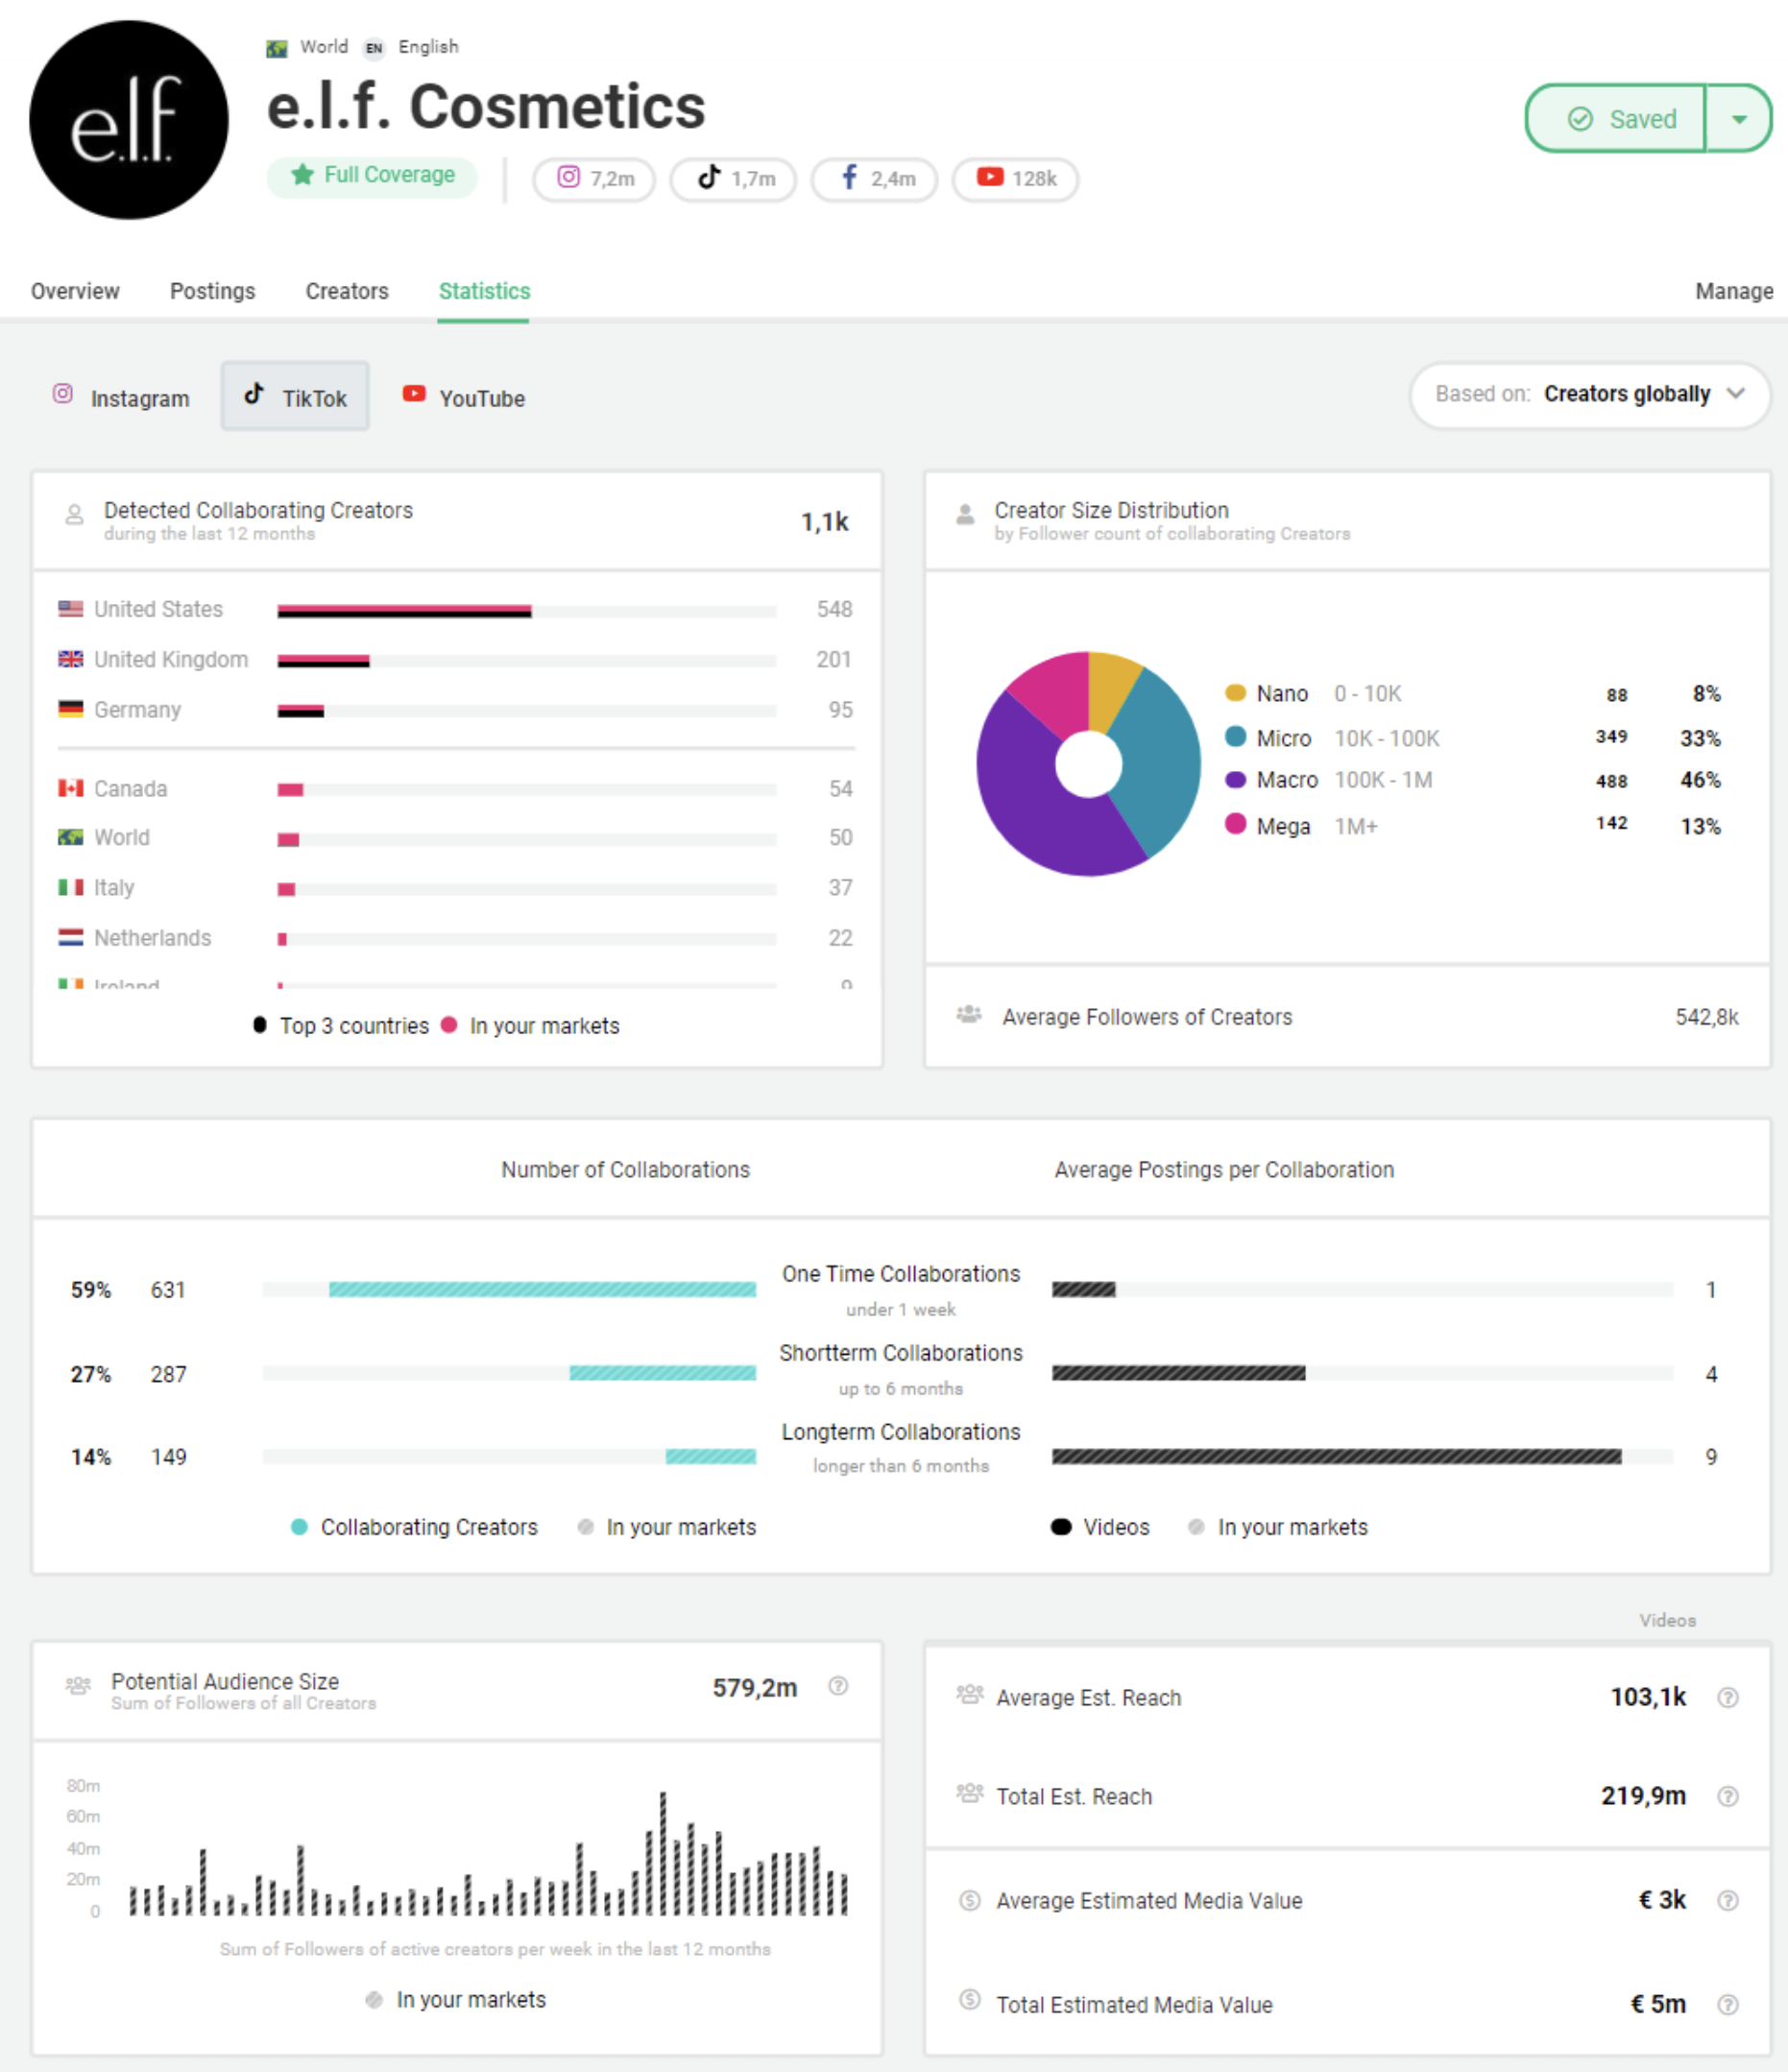
With Storyclash, you can get insight into the TikTok strategy of any brand. You can easily check how many creators they work with, how often creators post about them, and how good the engagement is. Drill-down into the performance of every video, both from the brand and from the influencers they work with.
Take cosmetics brand E.L.F, for example. Storyclash data shows the brand worked with 1.1k TikTok creators over the last 12 months. They posted 3.1k times, reaching a potential audience of 579.2m.
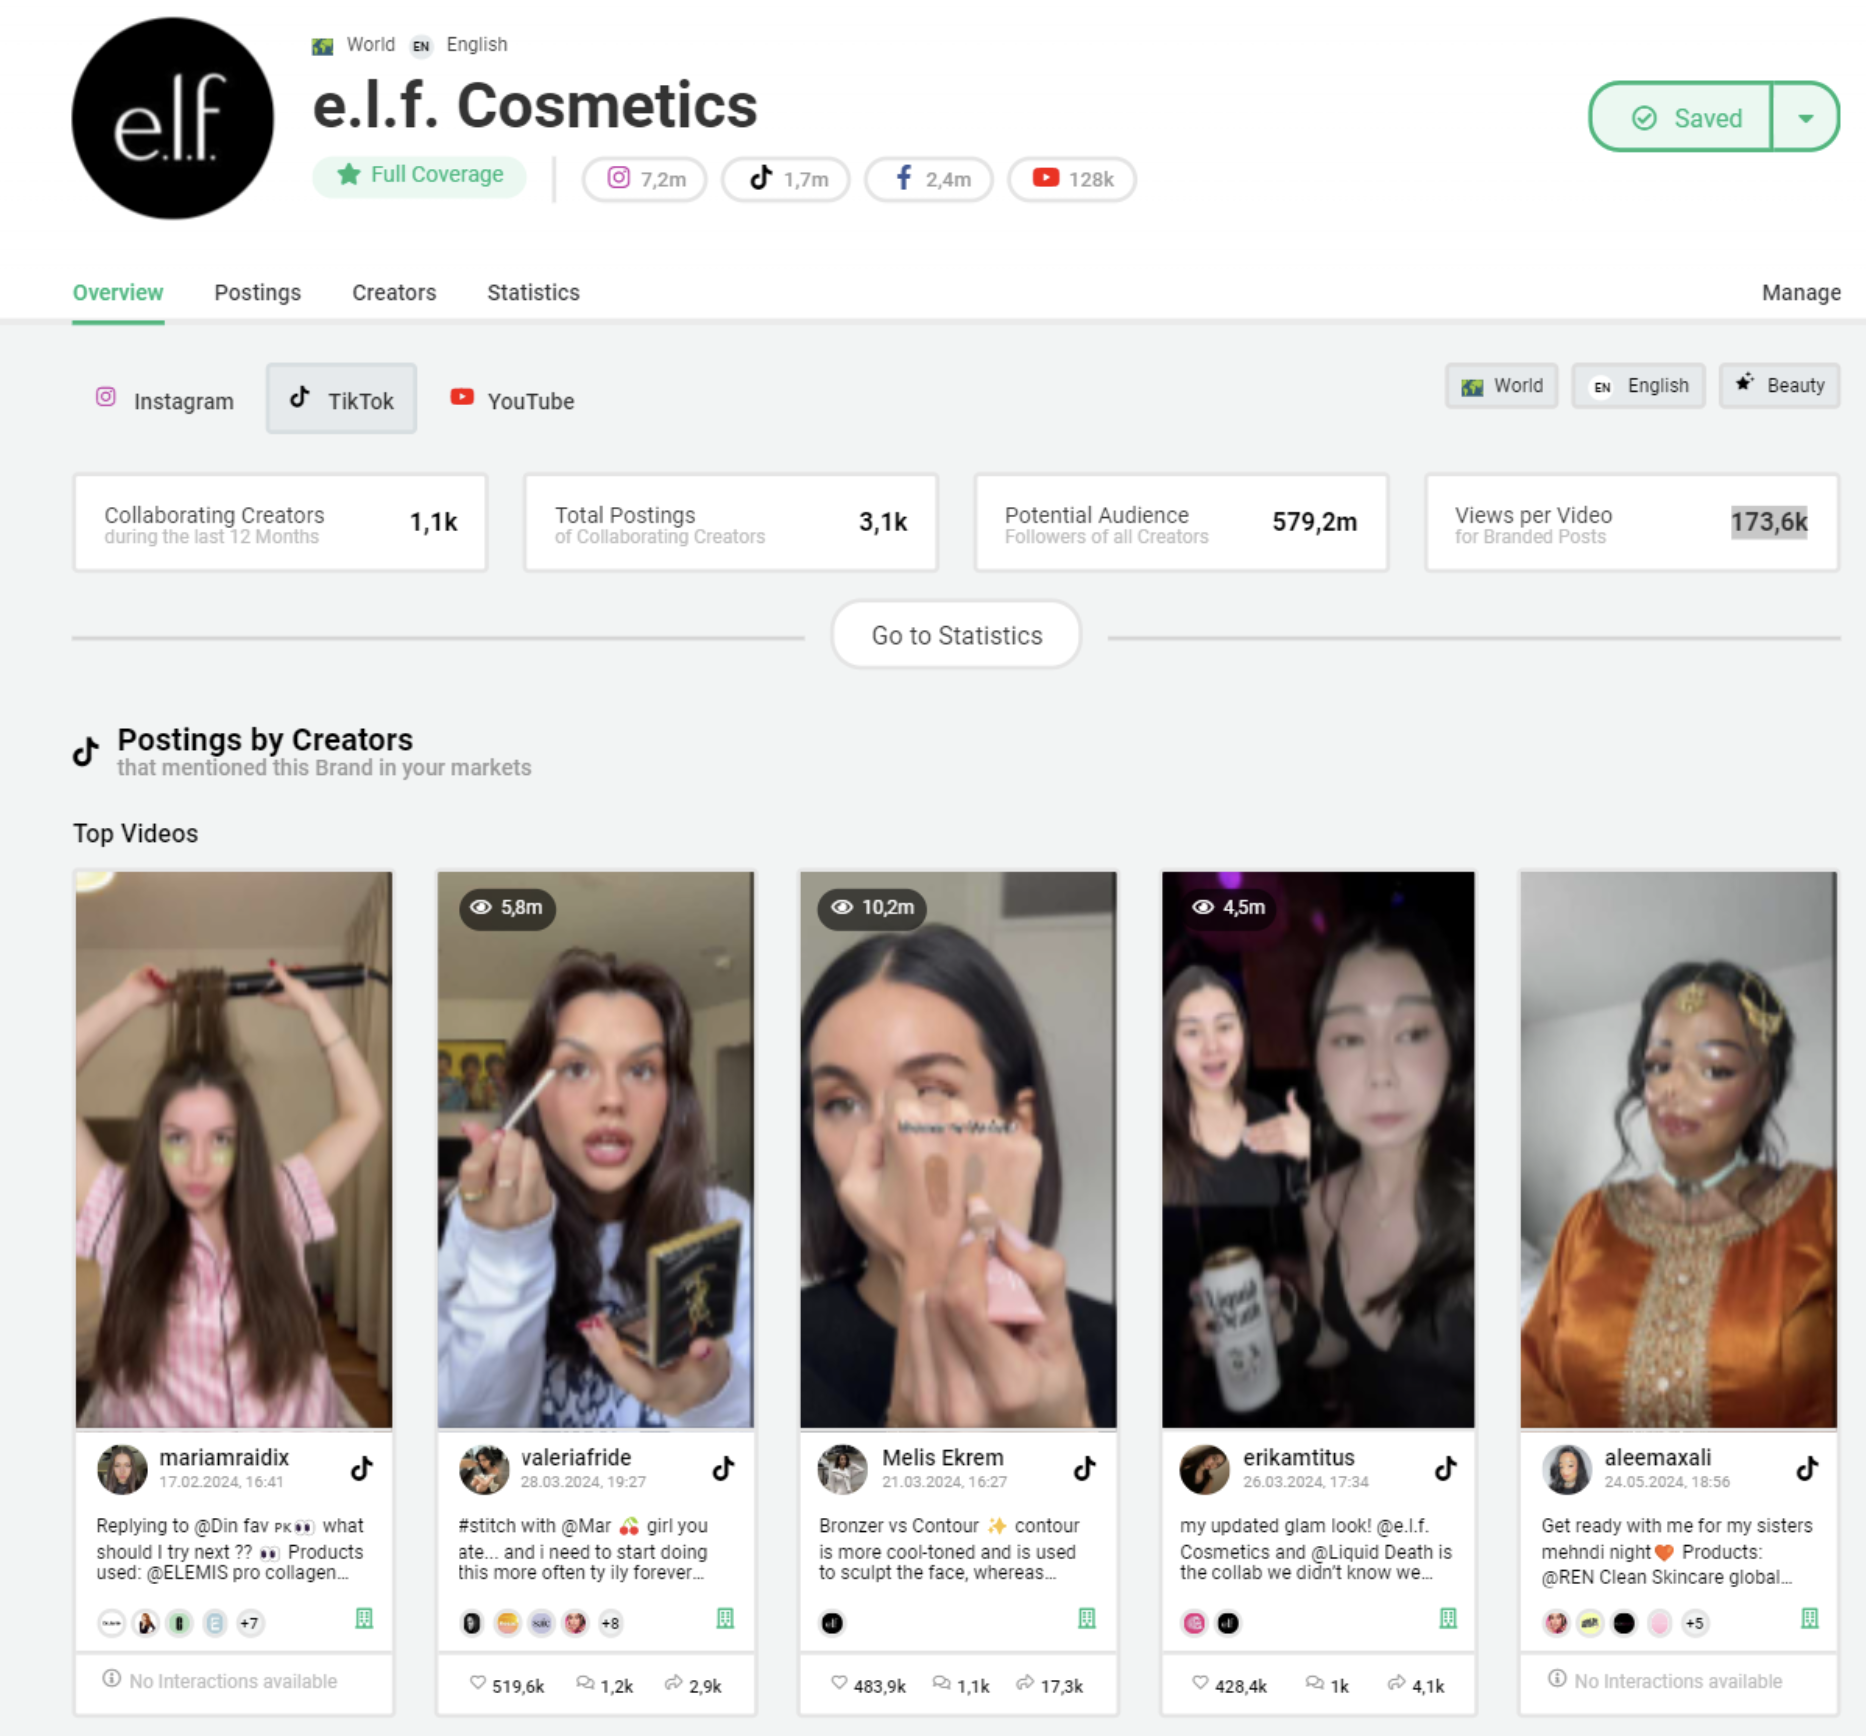
With their owned media strategy, the brand has an estimated reach of 513K, and an engagement rate of 1.2%.
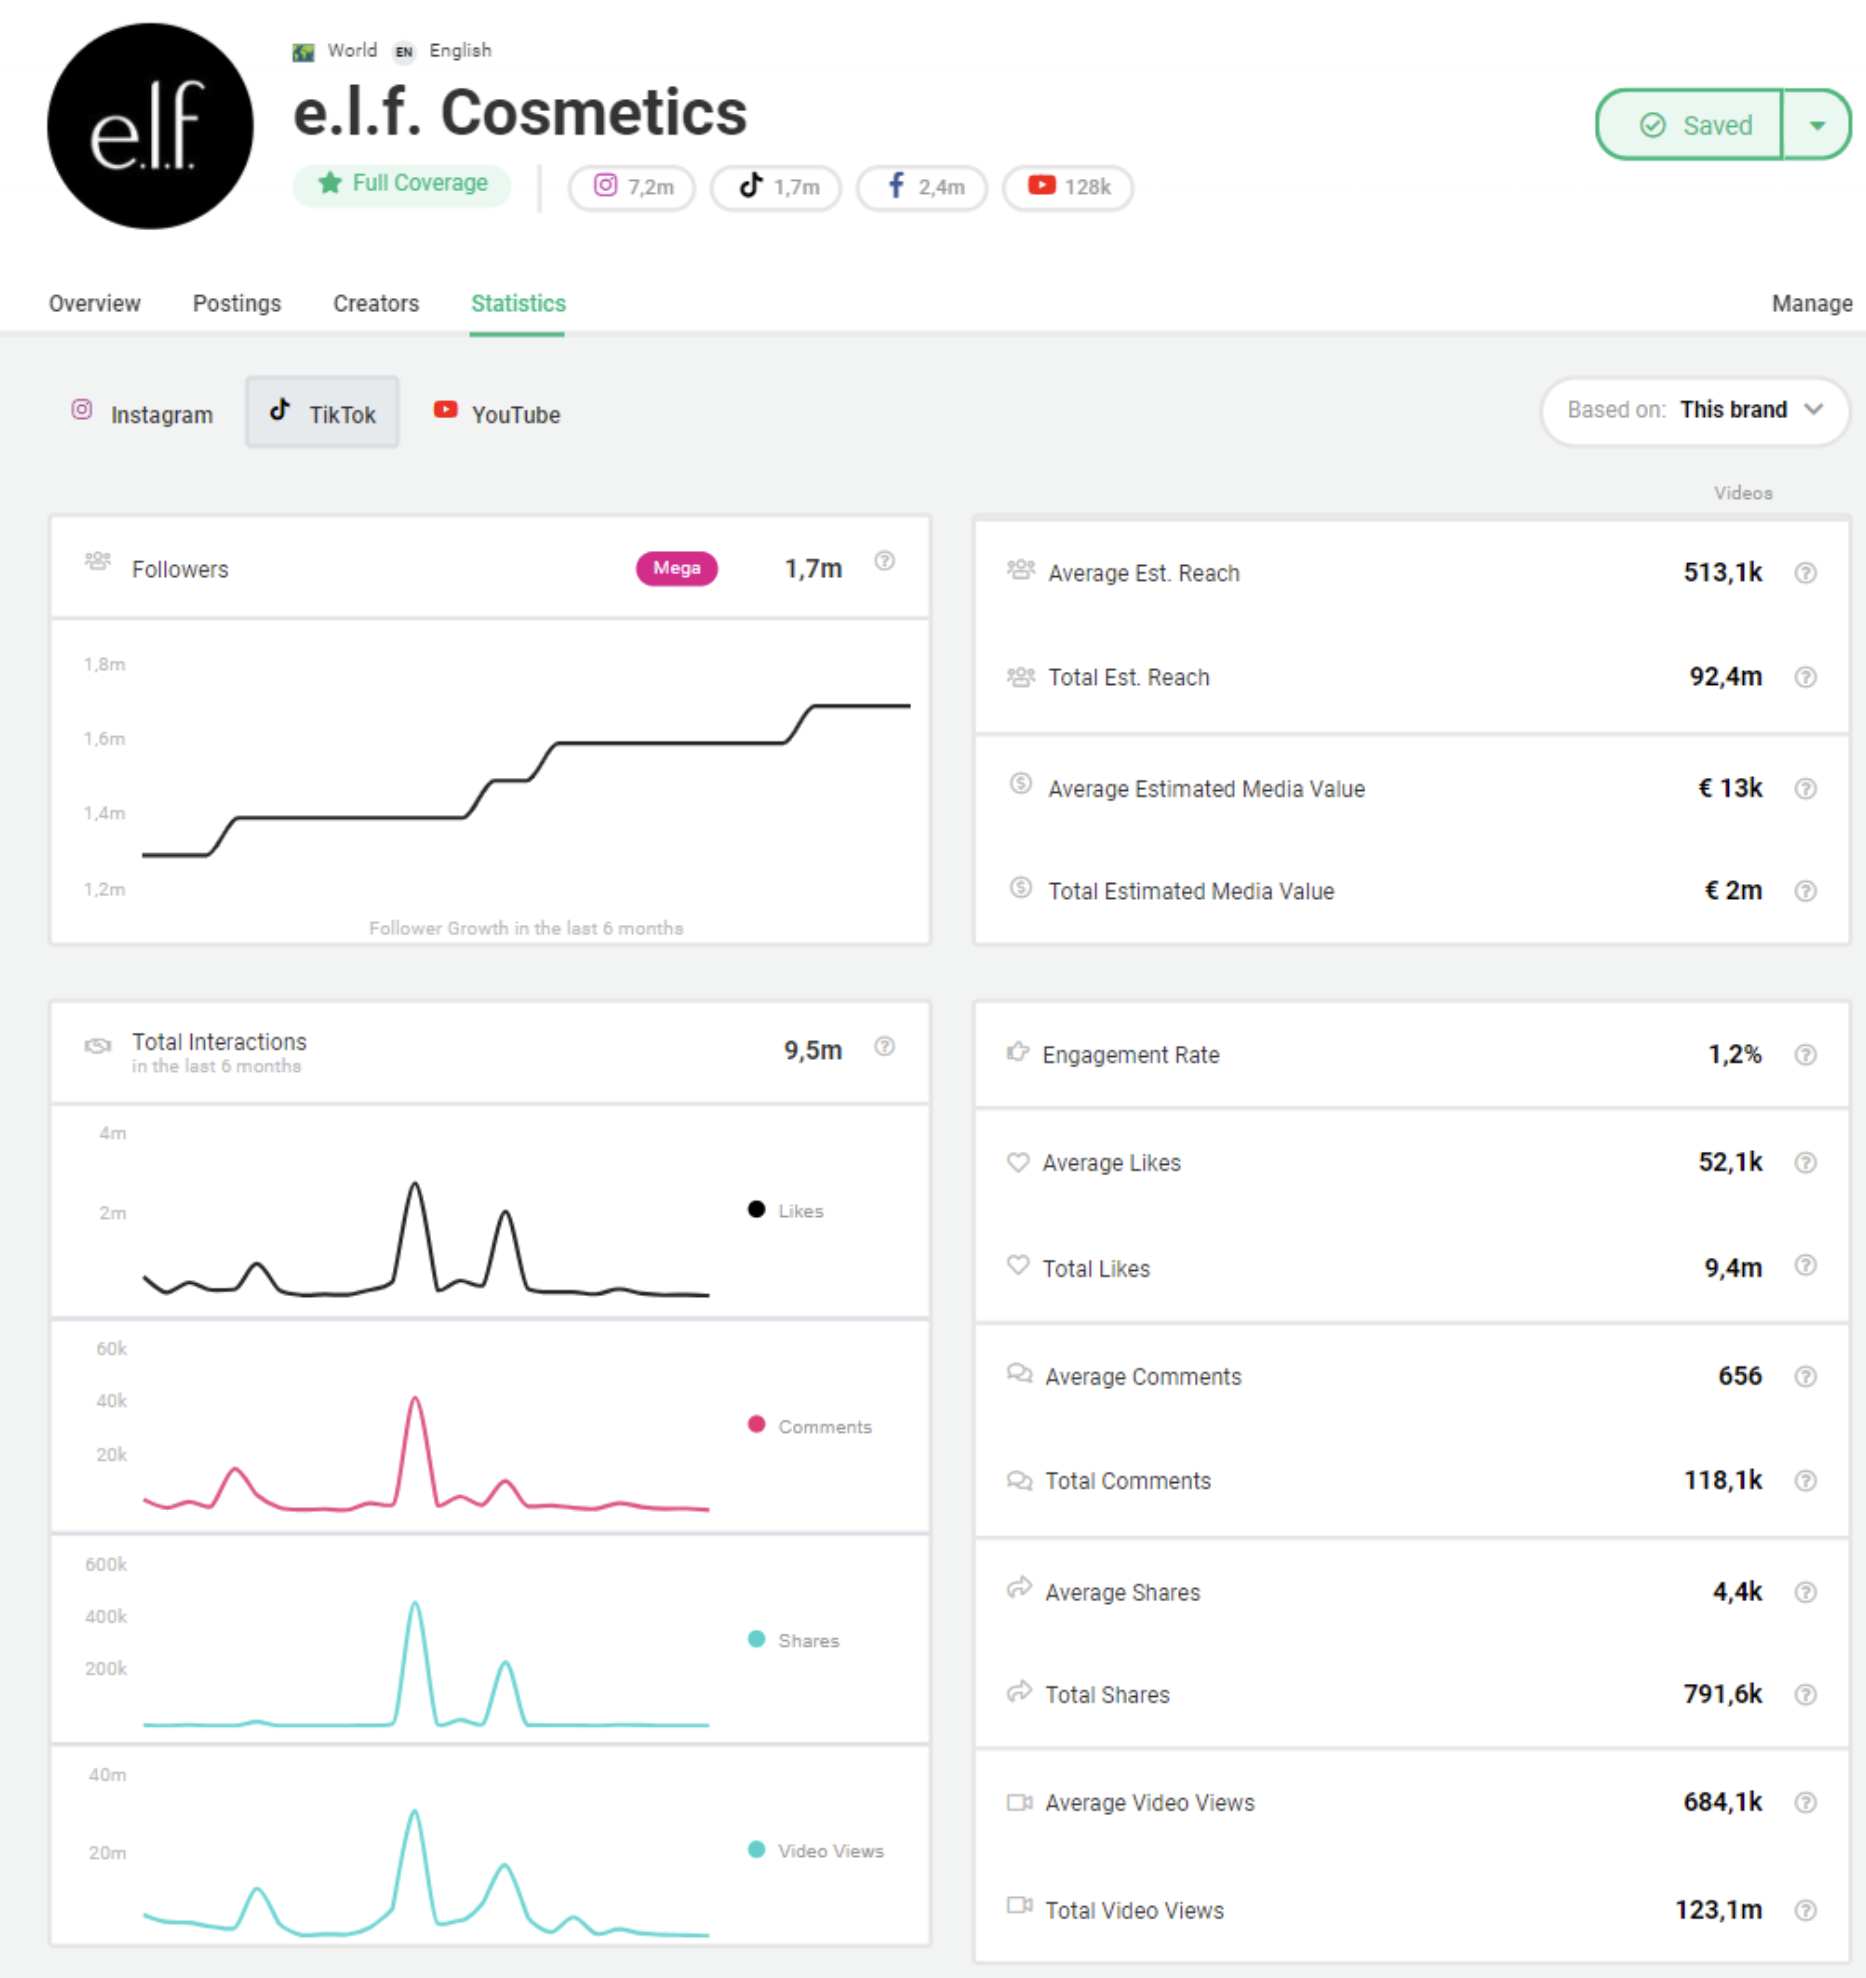
Toggle between the brand’s own performance and the performance of their creators to compare. For example, creator posts generated an engagement rate of 3.2%, which is significantly higher.
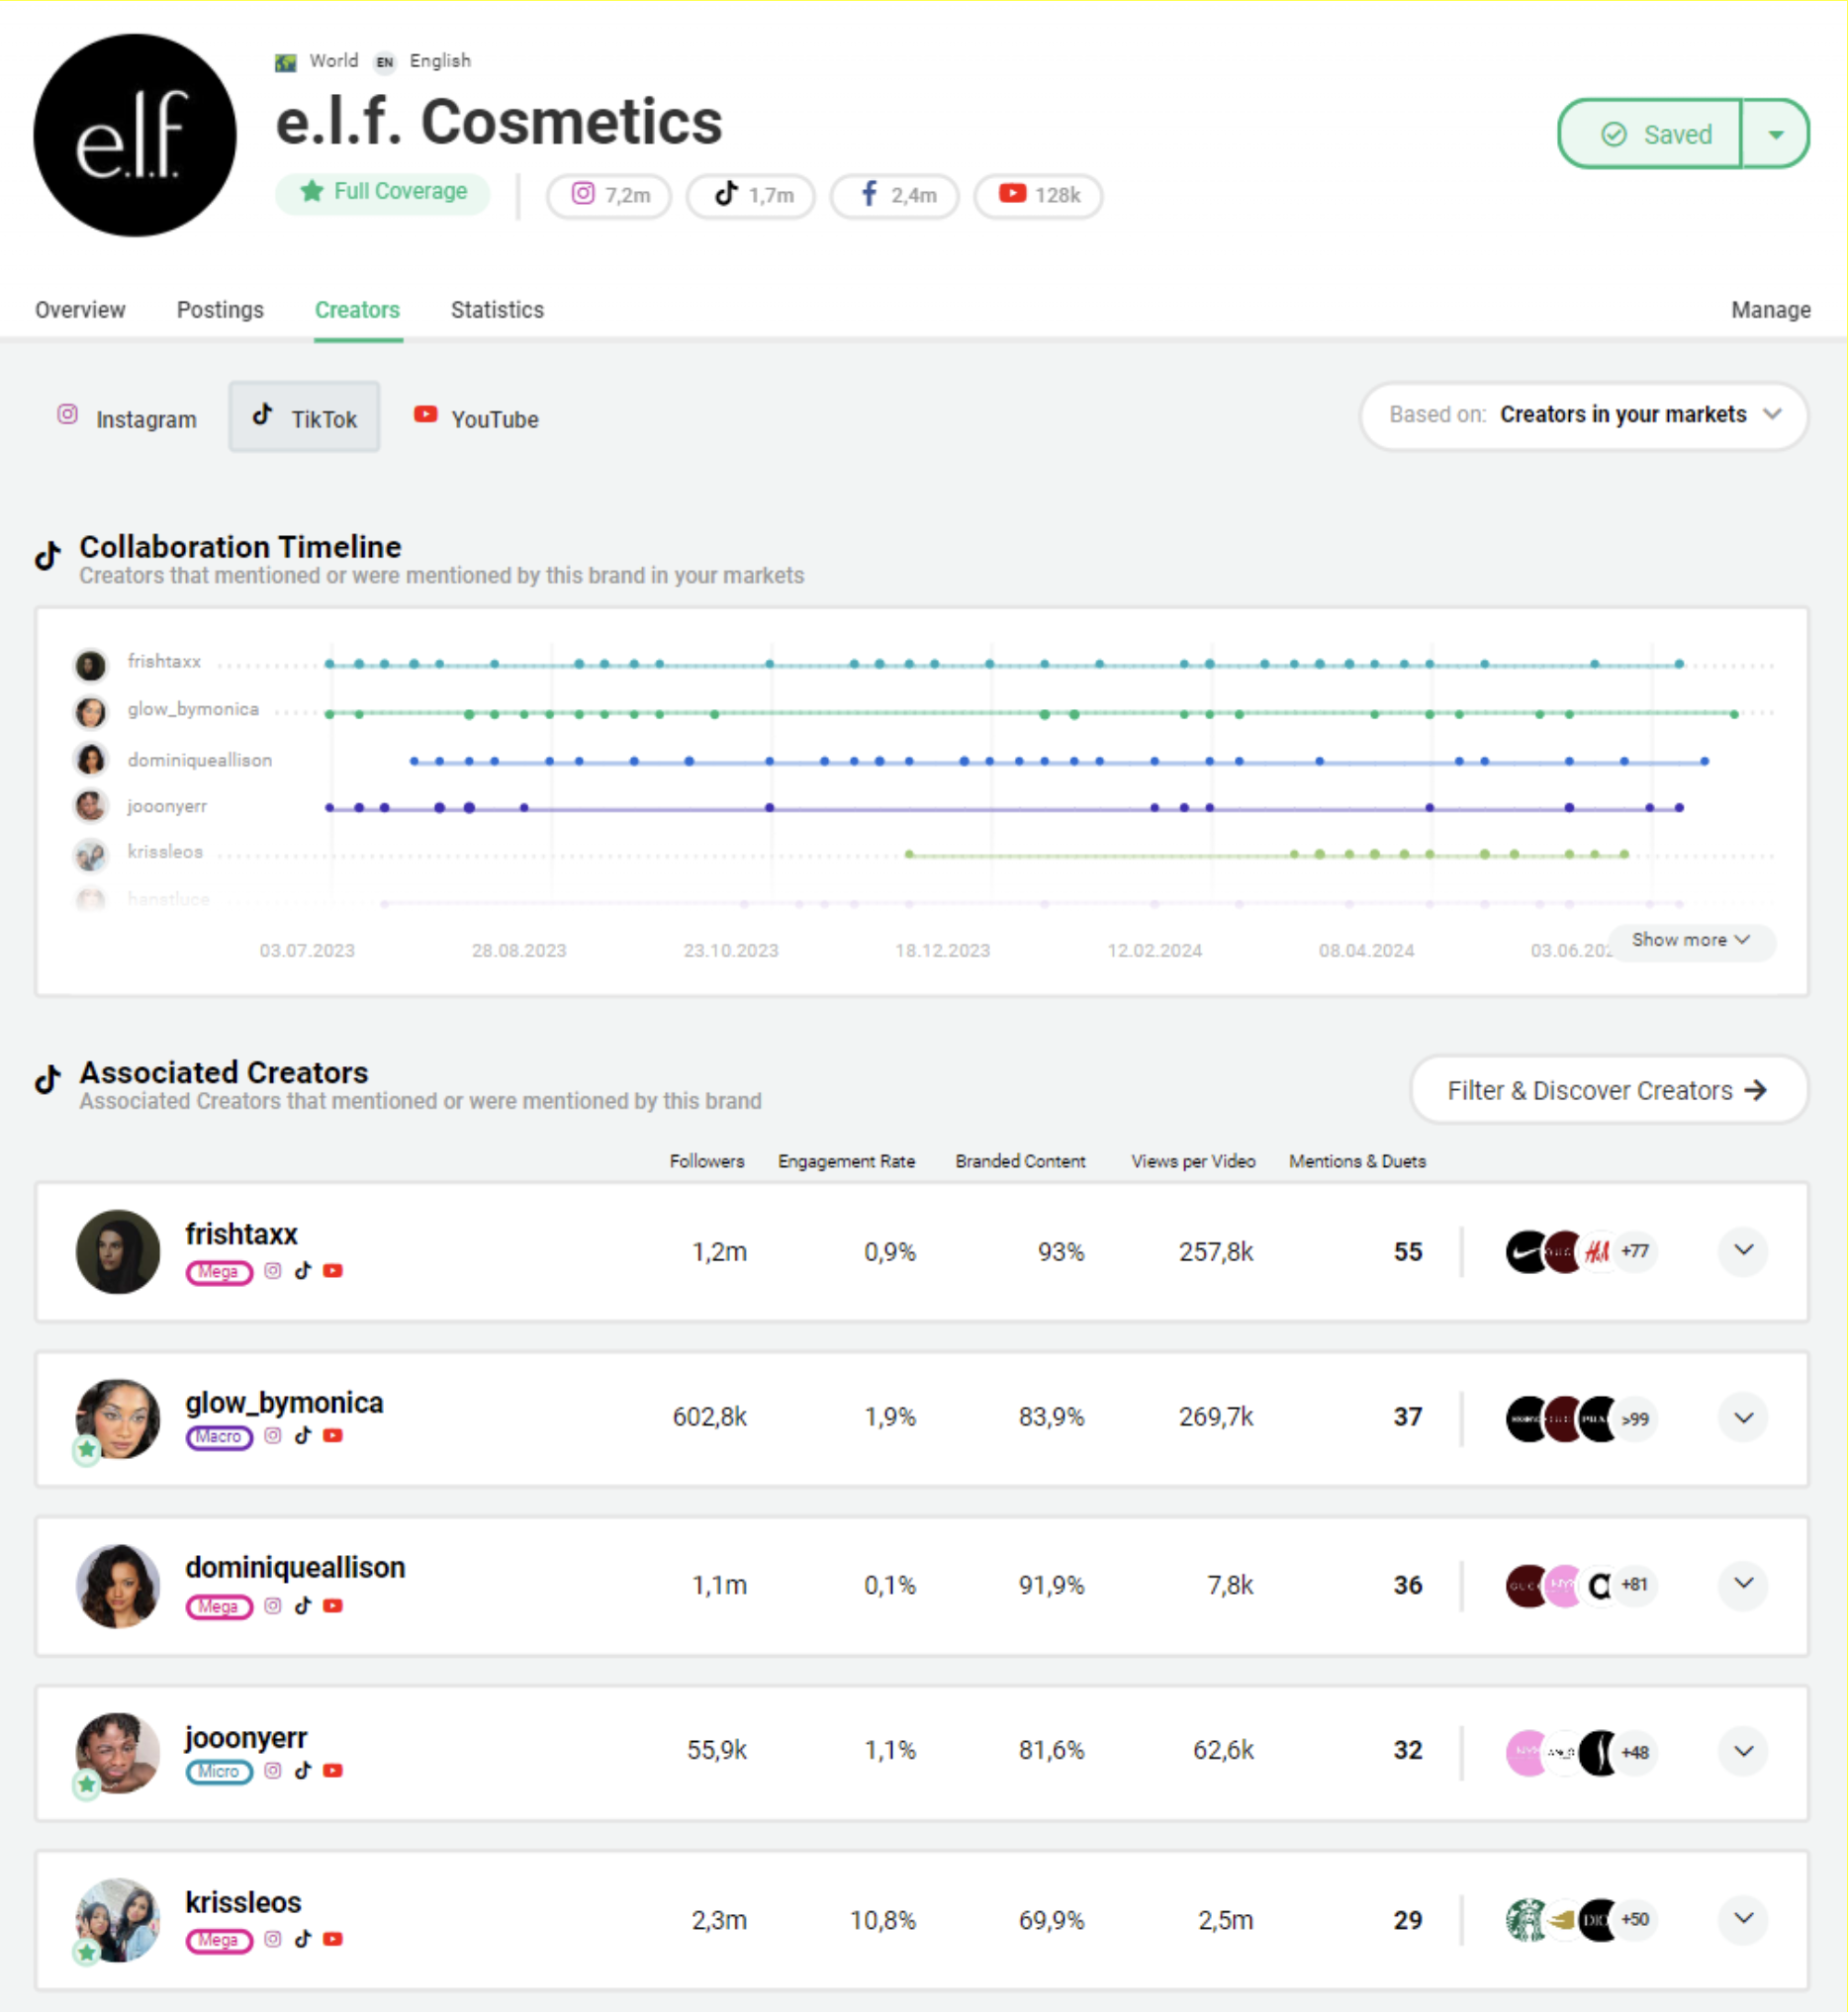
You can also do a deep-dive to see which creators a brand is working with and analyze the KPIs of their collaboration:
Looking for detailed analytics of a TikTok video? Just click on the content to see how it performed. For example, TikToker Malia Elaine posted this GRWM and tagged E.L.F, generating 138k views and an estimated media value of €3k.
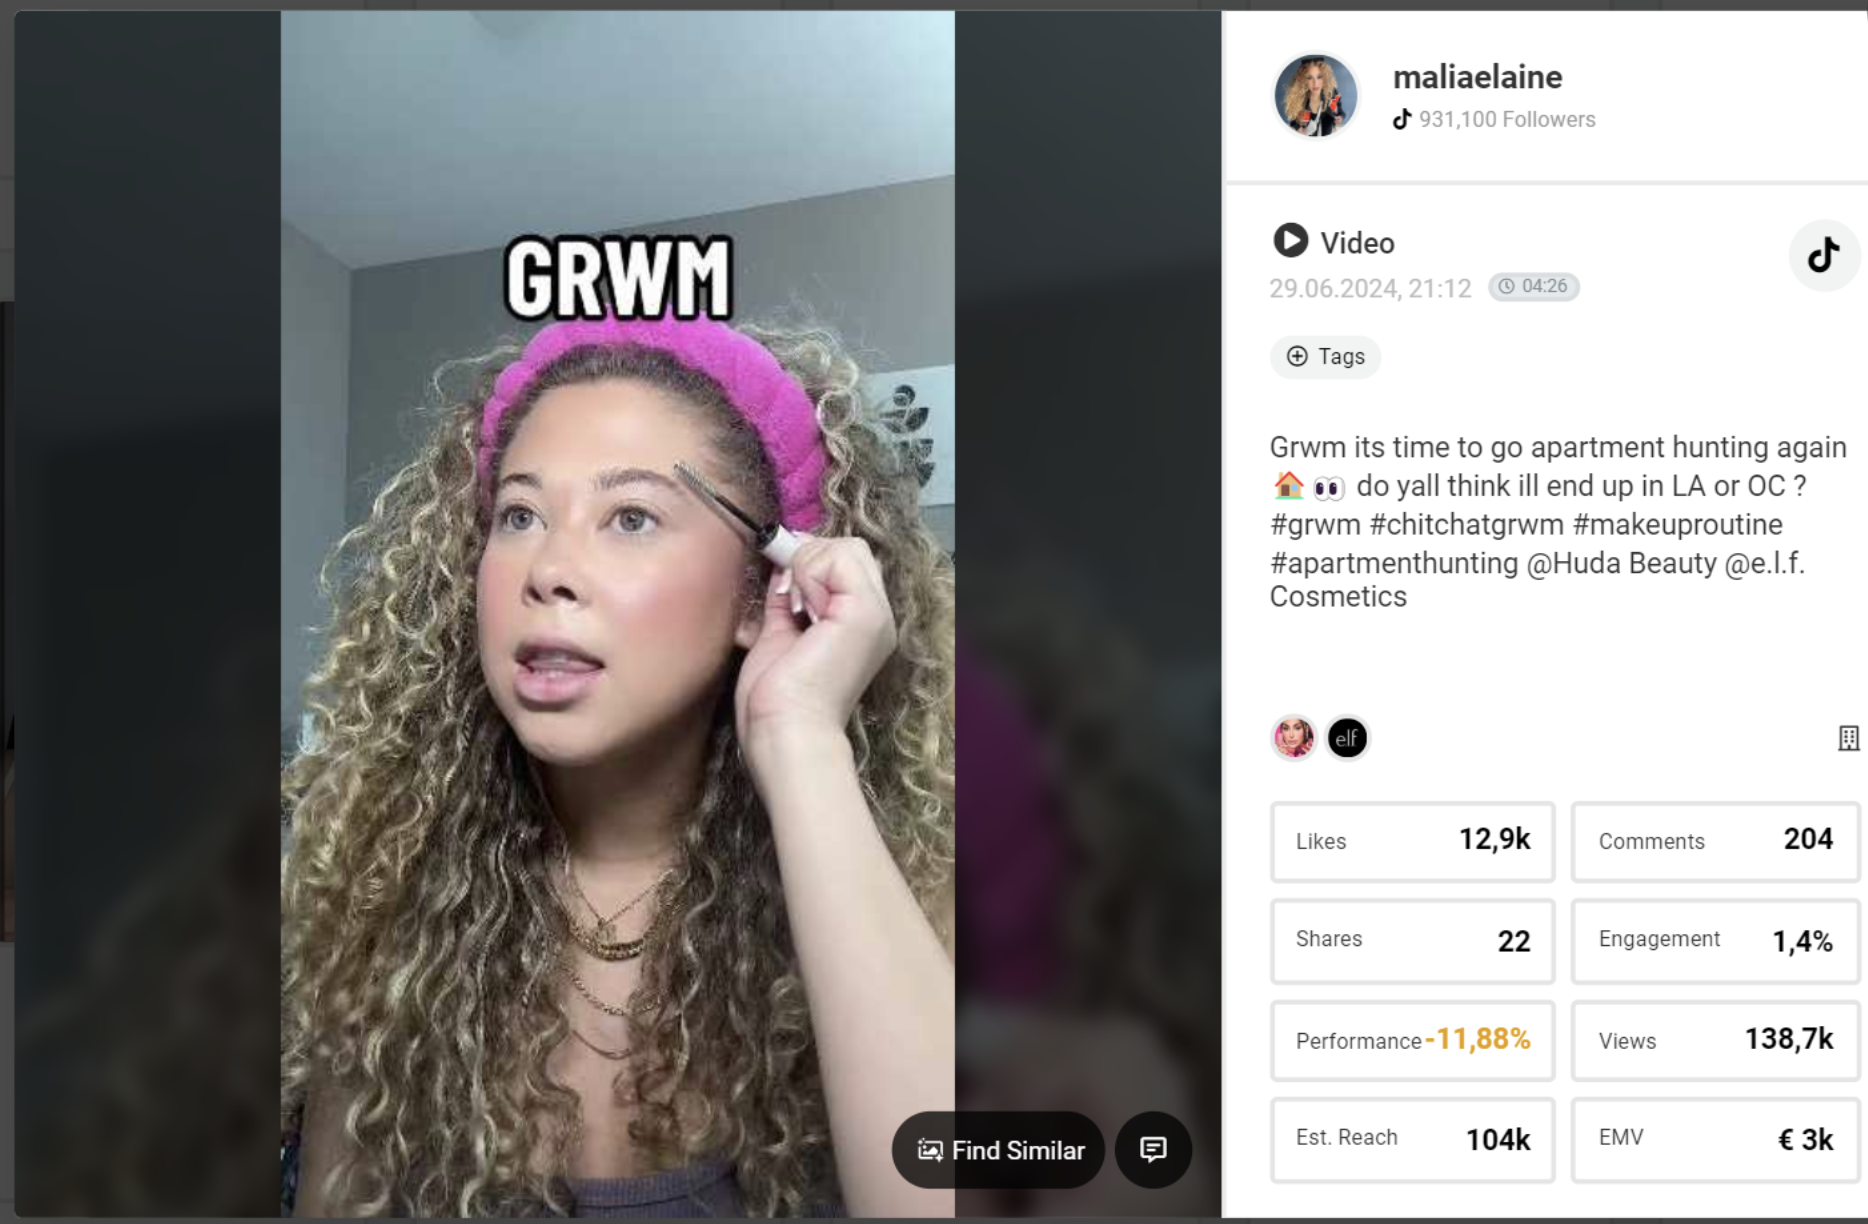
Looking for detailed analytics of a TikTok video? Get detailed KPIs for the influencer post of any brand:
How to track influencers on TikTok
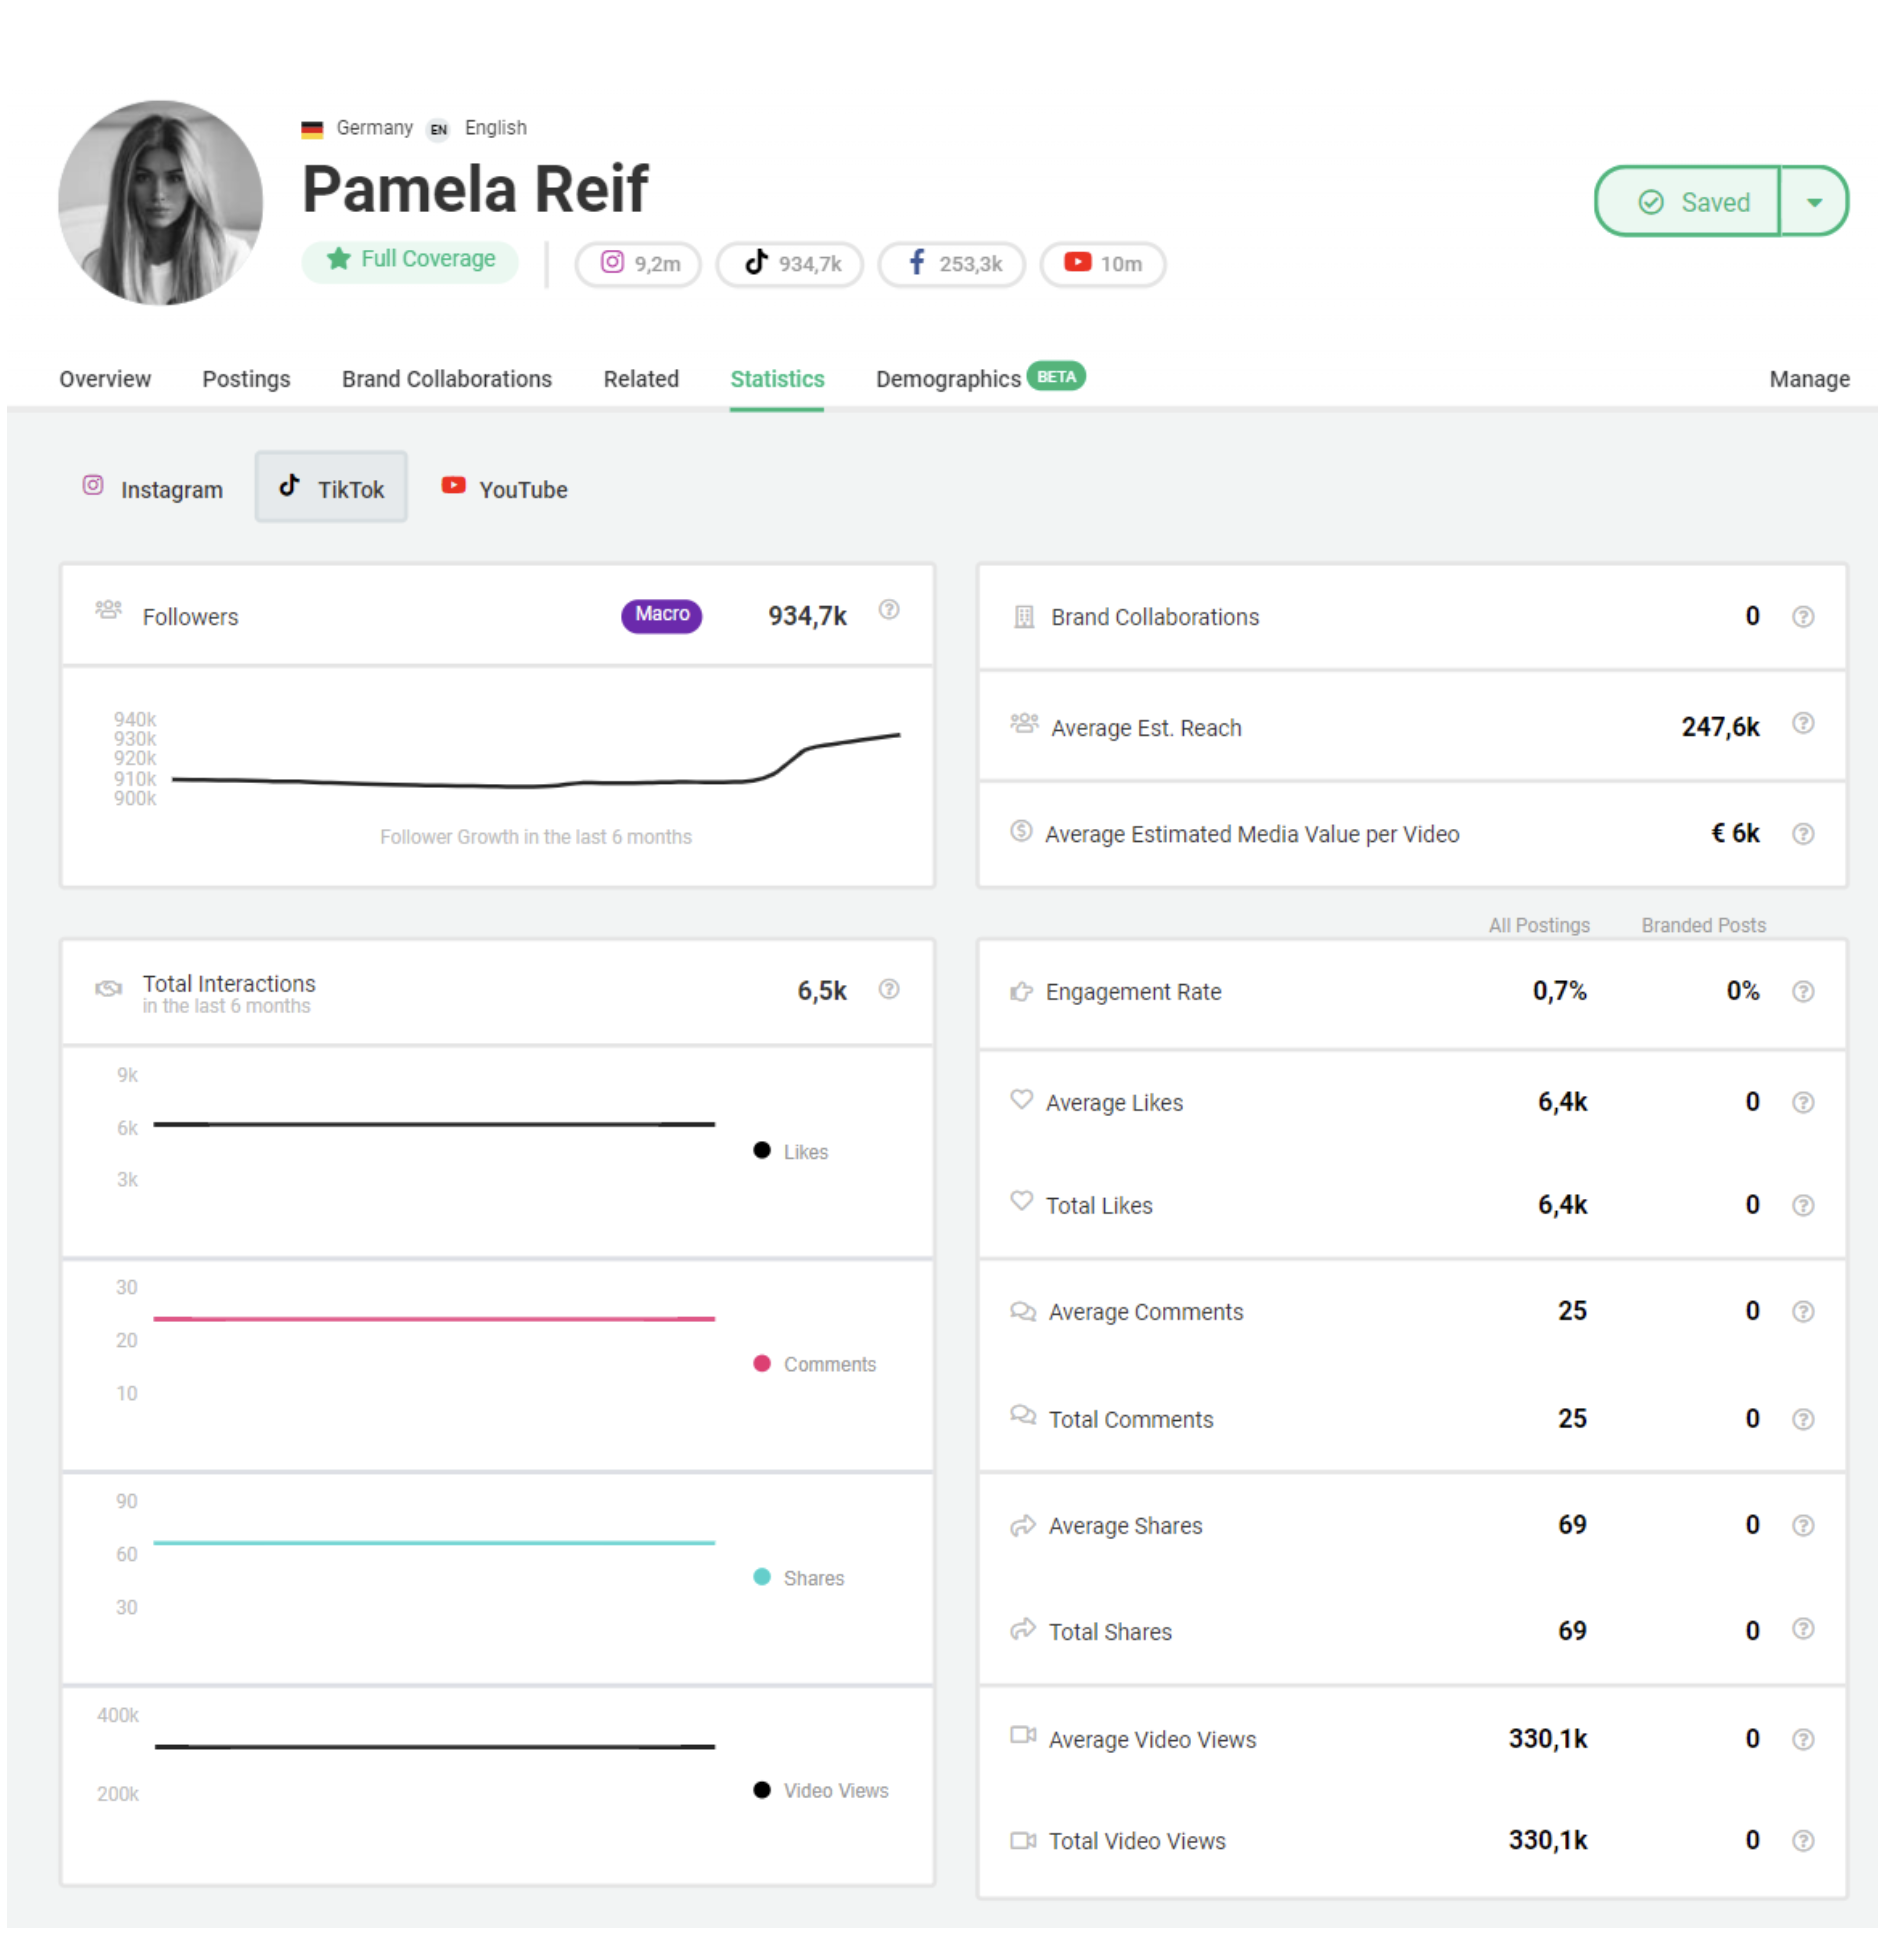
With Storyclash, you can track the deep-dive into the content performance of any influencer.
Let’s take a look at Pamela Reif. At a glance, you can see that she has 934k followers on TikTok, and can therefore be considered a macro influencer. The estimated average reach is 247k, and the engagement rate is 0.7%.
Want to learn more about TikTok Analytics?
Book a demo today to find out more or see Storyclash in action!